The research sample is representative of the Czech adult (18+) population and was created using quota sampling; the quotas regard the participants’ sex, age, education, region of residence, and the population size of their place of residence. We further strengthen the representativeness of the sample by weighting for deviations from the main quota characteristics, as well as weighting for past voting behaviour in the October 2021 Chamber of Deputies election, the January 2023 second round of the presidential election, and for social/employment status. Data collection using online interviewing (CAWI method) of participants registered with the Czech National Panel is provided by the STEM/MARK agency, which, like STEM and the Czech National Panel, is a member of the SIMAR association of research agencies and follow its industry standards.
At the end of the final week of polling, SPD, Trikolora, PRO, and the Free Citizens’ Party announced that they would run together on SPD’s candidate lists in the upcoming elections. This change will be reflected in the 13th STEM model next week. Recent developments in international politics also appear to be starting to influence the results, particularly the positions of political parties on the defence of the Czech Republic, the war in Ukraine, and events surrounding U.S. President Donald Trump.
The eighth election model of the series was based on the responses of 1,571 participants. The respondents were interviewed in 3 waves between the 7th and 25th of February 2025. During these weeks the spring school holidays took place, always in different parts of the country.
For the best possible results, we check the attention of respondents when filling out the survey, check the logical link between the answers to questions, and we exclude survey answers that were completed suspiciously quickly. The statistical error of the sample is around ±1 percentage point for the smallest parties, and around ±3 percentage points for the larger parties.
The reported preferences and model are part of a unique research series, The Weekly Model, produced by STEM for CNN Prima News. Detailed description of the methodology can be found on our website:
https://www.stem.cz/?metodologie=tydenni-model-pro-cnn-prima-news-2025
SUMMARY
The STEM research institute, in cooperation with CNN Prima NEWS, provides the public with a new weekly election model.
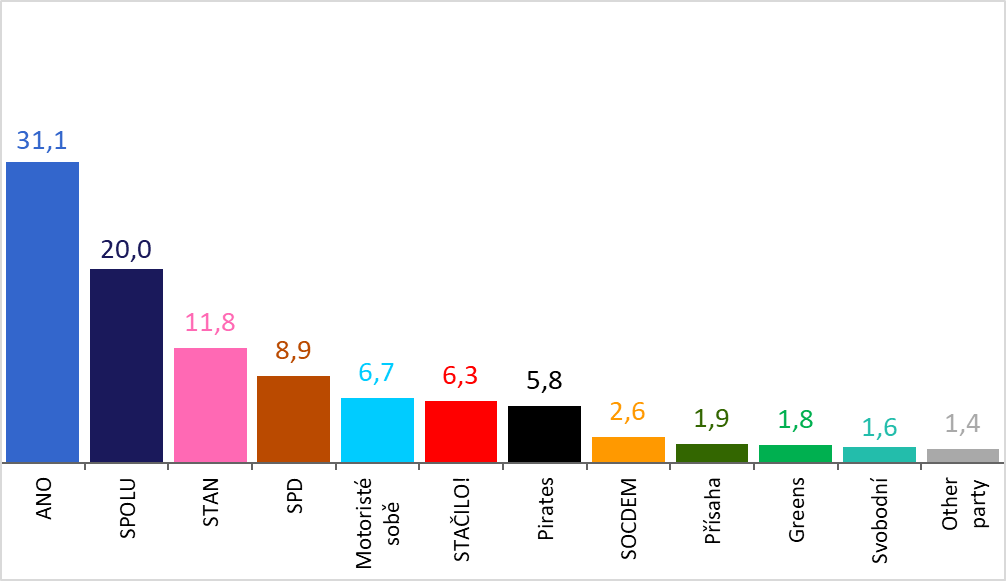
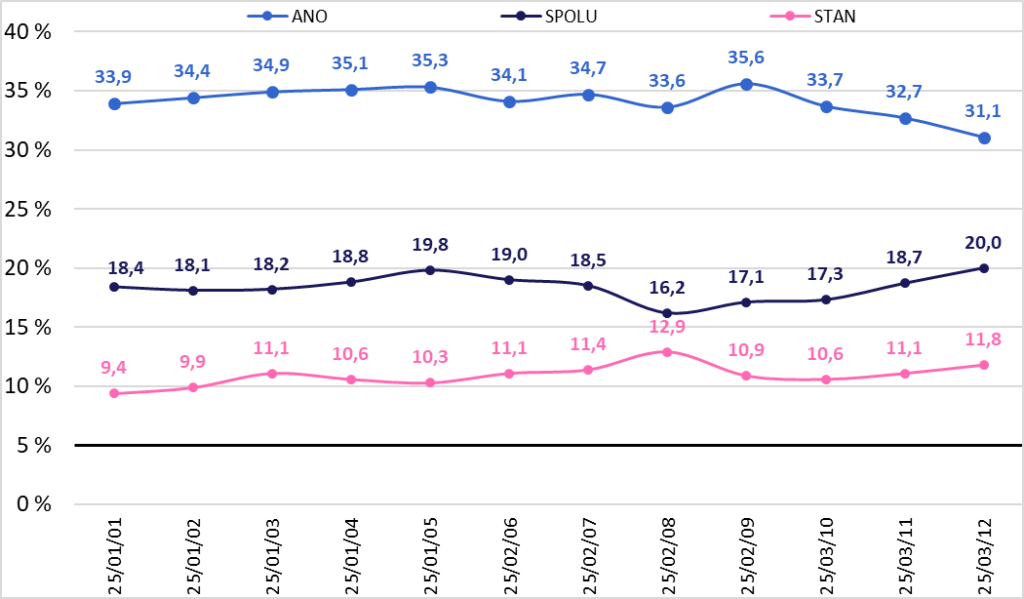
The election model created by the STEM analytical institute based on data from the second half of March continues to be led by the ANO movement, although it has gradually weakened over the course of the month. In the current model, ANO would receive 31.1% of the vote, which would translate into 75 seats. Among the governing parties, the SPOLU coalition remains the strongest. Other parties that would currently enter the Chamber of Deputies include the STAN movement, SPD, Motoristé sobě, the STAČILO! movement, and the Pirates.
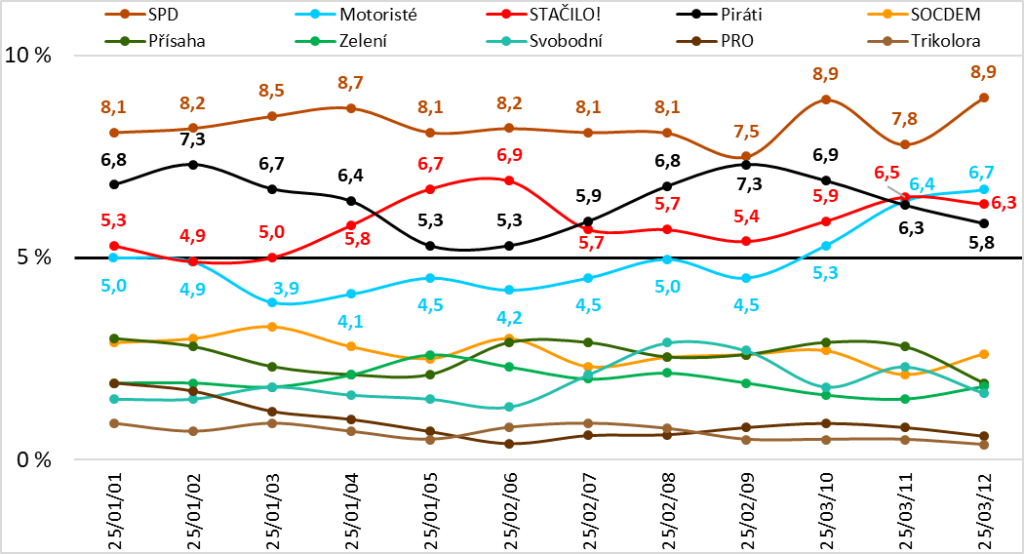
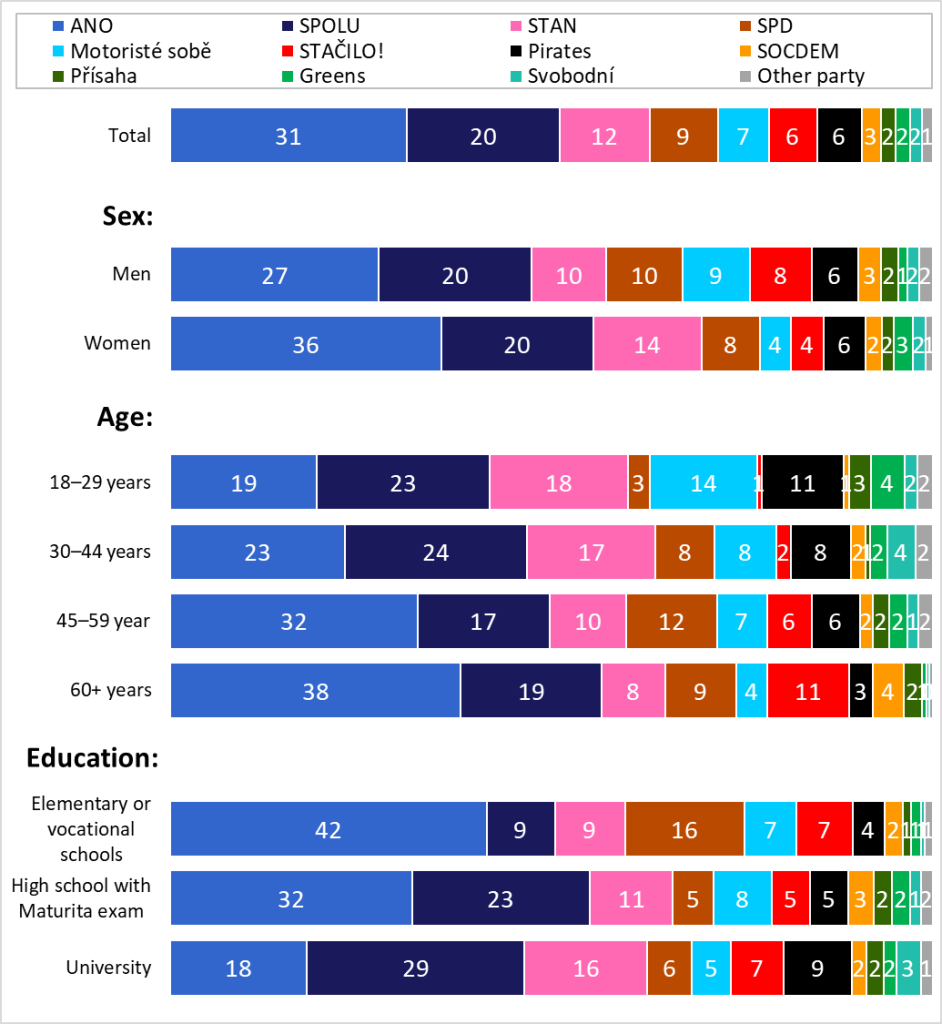
The STAČILO! movement, with an observed 6.3% share of the votes, would gain 12 seats. Its supporters are primarily found among older age groups and people without a university education.
The Motoristé sobě party has significant potential, and the share of committed voters grew gradually over February. With a 5% result, the party would narrowly make it into the Czech lower chamber, earning 9 seats. “The support for the Motoristé sobě is not yet consolidated. Whether it can be stabilized and the party can expand its voter base will be shown by further developments over the course of the campaign,” adds Martin Kratochvíl. He notes that Motoristé sobě show higher levels of support among the youngest age group, people with a secondary education, and men.
SPD continues to dominate the protest vote segment, currently polling at 8.9%, which would earn them 19 seats. “The current model still does not account for the officially announced alliance of SPD with Trikolora, the PRO movement, and the Free Citizens’ Party, but it seems that support from these three smaller parties is already naturally flowing toward SPD,” explains STEM analyst Martin Kratochvíl. The movement traditionally performs well among people without a high school diploma.
The SPOLU coalition would reach 20% in the second half of March, representing its best result since the beginning of the year and a potential gain of 46 seats. “The rise in support visible throughout March may be linked to the coalition’s stance and public statements regarding international issues and the security and defense of the Czech Republic,” Kratochvíl adds. Support for SPOLU remains evenly distributed across genders and age groups.
The STAN movement also recorded a slight increase in March, reaching 11.8%, which would translate into 25 seats. STAN’s main voter base is among younger and the youngest voters.
The Pirate Party has shown highly fluctuating results in STEM’s model since the beginning of the year, ranging between 5 and 7%. Over March, their support has gradually declined to just under 6%. The Pirates’ position remains very uncertain; notably, their core voter base is significantly smaller than it was last year. “Only the coming weeks will show whether the Pirates can clearly overcome the setbacks from previous crises and launch a credible campaign,” Kratochvíl concludes.
PARTY PREFERENCES
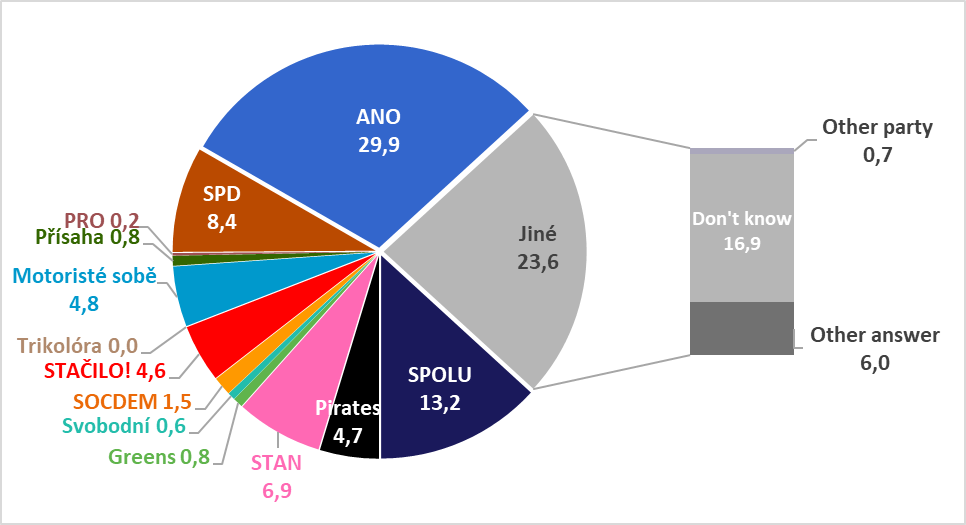
The party preferences show the distribution of political preferences among the entire population of respondents, i.e. including undecideds and people who are unable or unwilling to name a party preference or openly say they will not vote for any party. STEM asks for political preferences using an open-ended question and records the participants’ answers verbatim. Thus, we list groupings mentioned by the participants alongside undecideds and negative responses.
The preferences for each party are lower than would be expected from the actual election result, which is decided only by the voters who actually turn out.
“If you voted, which party would you vote for next week in an election for the Chamber of Deputies of the Parliament of the Czech Republic?”
(data for the second half of March 2025;
open question – no selection from a list of parties or coalitions)
Source: STEM for CNN Prima News, model 2025: 12, March 2025, N=1550, CAWI
ATTENTION: PARTY PREFERENCES DO NOT REFLECT THE ELECTION RESULT!
THE TOTAL MAY NOT ADD UP TO 100% DUE TO ROUNDING.
VOTER MOTIVATION
At the latest since the 2013 Czech general elections, we have seen significant changes in the electoral strategy of various voter groups. The number of sworn party voters has declined, the spectrum of political parties and movements has grown, and there are more frequent changes of party preference. The fluctuation between voters and non-voters is intensifying and the proportion of those who decide whether and whom to vote for only shortly before the elections is increasing. The peak of these phenomena so far was the 2021 parliamentary election – six months before the elections, a third of potential voters had been unsure about their participating in the election or who they might vote for.
Thus, uncertainty is becoming increasingly important in estimating political preferences and the fluctuations of electoral sentiment, and it makes sense to look at this phenomenon more closely and analyse its role. We have therefore prepared an overview of the groups of the Czech adult population according to their motivation to vote.
We construct an indicator of motivation to vote based on three questions:
a) willingness to vote in the upcoming election,
b) general interest in political events,
c) the strength of the relationship with the preferred party or movement (if the participant does prefer any).
We thus find that the Czech public can be divided into three groups in terms of voting motivation:
- Less than half (45–50 %) of people go to the polls regularly, their participation in the parliamentary elections is very likely and they are mostly clear about whom they want to vote for.
- One third of the population (30–35 %) is either unsure about their participation in the elections, hesitates about their participation or is unclear about their choice of party.
- Approximately a fifth of the population is made out of people who do not vote and their motivation to vote is negligible.
People eligible to vote
grouped by motivation to vote in the second half of March 2025 [%]

Source: STEM for CNN Prima News, model 2025: 12, March 2025, N=1550, CAWI
The sum of the share of Stable voters and Undecided voters (80% in the second half of March) can be considered the theoretical maximum turnout that could be achieved in the Czech Republic currently. The overview of the motivation to vote further serves as a starting point for the construction of the turnout and voting model.
WILLINGNESS TO VOTE FOR INDIVIDUAL PARTIES AND MOVEMENTS
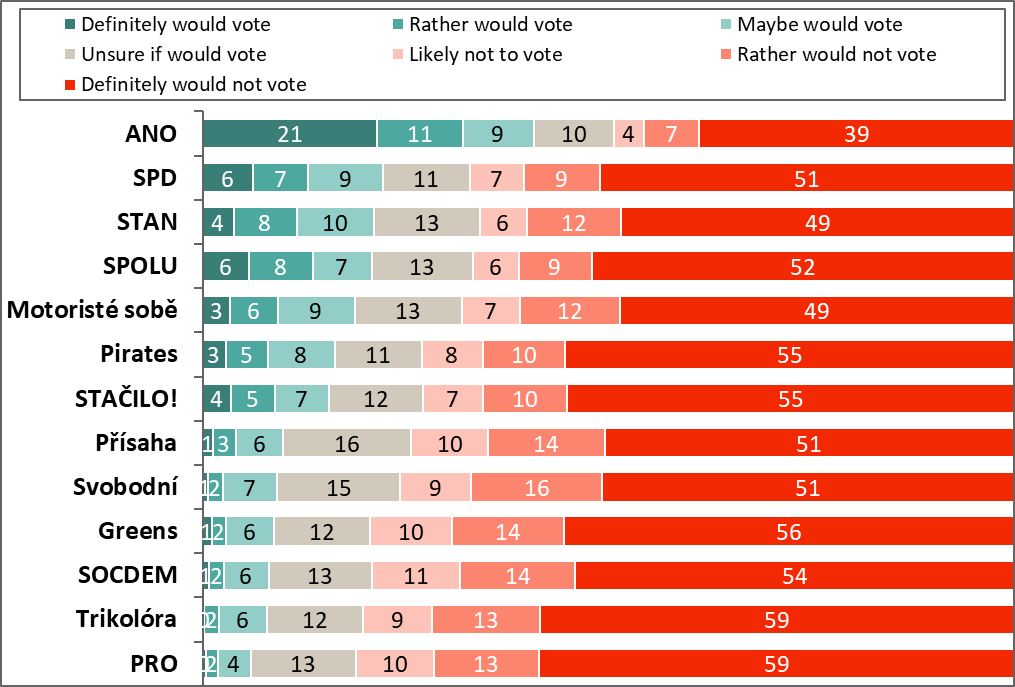
In addition to stating direct support for a party or movement in an open-ended question, the research also inquires about willingness to vote for the main Czech political groupings. On a seven-point scale, participants can express the degree of “acceptability” for each of the parties, movements or coalitions.
Willingness to vote for respective political parties and movements
– second half of March 2025
“If the election for the Chamber of Deputies were held today, would you…”
Source: STEM for CNN Prima News, model 2025: 12, March 2025, N=1550, CAWI
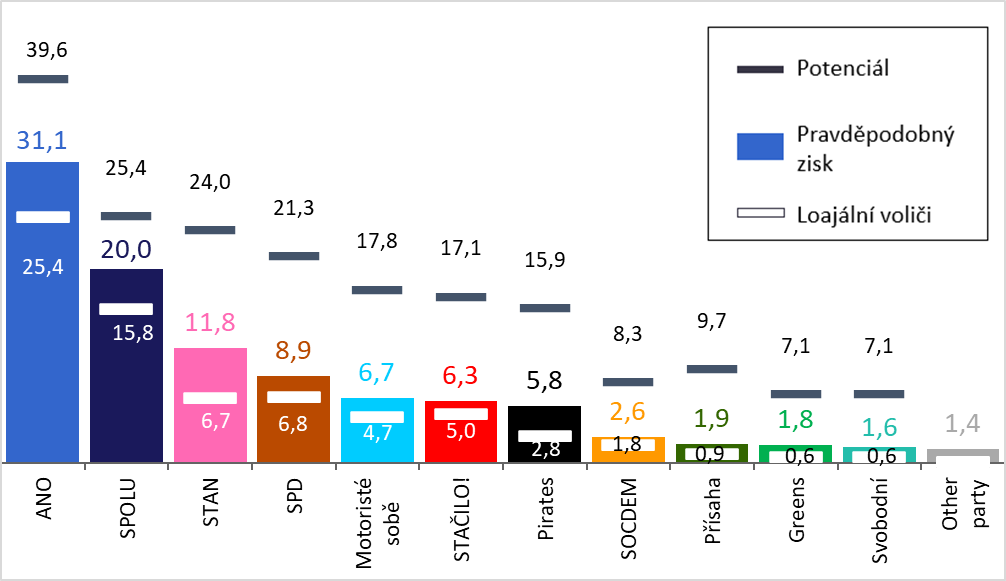
The maximum hypothetical amount of support, the so-called potential for a given grouping, is calculated as the sum of the weights of the votes of those who chose one of the top three answers (“Definitely would vote”, ”Rather would vote” vote and “Maybe would vote”) for this grouping and who also belong to the groups of Stable and Undecided voters.
ELECTION MODEL
It is not easy to build an election model because it is difficult to estimate various parameters: which survey participants will actually participate in the election, whether the voters’ turnout motivation will be similar to the previous election or not, how last-minute emotions will be reflected in the election result and so on.
In surveys, members of the public like to present themselves as responsible citizens: when we pose a direct question, we find that up to 70% of voters want to participate in elections, but the actual turnout does not usually reach that level. Thus, the key to model electoral outcomes and voting patterns is to estimate the behaviour of hesitant and undecided citizens.
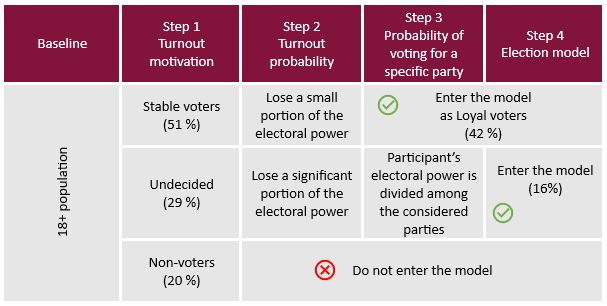
We follow a three-step process while calculating the STEM election model.
First, we identify the main groups within the public based on their motivation to vote, as described above. We do not take into account the answers of survey participants identified as Non-voters, and for the remaining two groups (Stable voters and Undecided) we estimate their probability of participation in a hypothetical parliamentary election.
We calculate the likelihood of participation in the election based on the participants’ answers to questions related to their long-term, past, and expected voting behaviour:
a) long-term tendency to vote,
b) participation in past parliamentary elections,
c) declared participation in a hypothetical general election the following week.
This probability ranges from 0 to 1, depending on how strong the participant’s voting motivation is. The weight of each participant’s vote in the model then corresponds to the probability of them turning up to the polls.
The turnout probability values are used to recalculate the data for the Stable voters group. This yields a new data set, which we refer to as Loyal voters. We treat these as the bottom threshold for the hypothetical support for the respective electoral groupings (parties and movements). In other words, these are the supporters that an electoral grouping is very unlikely to lose in the medium term, and whose support would likely only be shaken by some major scandal. Loyal voters form the basis of the STEM electoral model, as they represent about two-thirds of the votes in the model. With a modelled turnout of 58%, they make up about 42 percentage points.
Undecided voters contribute the remaining third of the votes in the model (in the second half of March 2025, this is about 16 percentage points). These votes are weighed not only based on the participant’s probability of turnout but also based on the probability of them voting for the parties they are seriously considering.
Figure of the process of selecting participants for the model
STEM Election Model
– simulated election outcome under a modelled turnout of 58%
Second half of March 2025 (results in %)
Source: STEM for CNN Prima News, model 2025: 12, March 2025, N=1550, CAWI
Election model, loyal voters, maximal hypothetical vote share
second half of March 2025 (results in %)
Source: STEM for CNN Prima News, model 2025: 12, March 2025, N=1550, CAWI
SEAT PROJECTION BASED ON THE STEM ELECTION MODEL
We can estimate the number of seats for each political grouping if we apply the legal rules for converting vote shares (as given by the STEM model) into seats in the Chamber of Deputies and estimate voter behaviour patterns in the respective electoral constituencies and the national turnout level.
The seat redistribution system in the Czech Republic traditionally favours parties with the highest share of the vote. This so-called “winner’s bonus” tends to be larger the greater the gap between the leading party and the others. An advantage is also held by parties with evenly distributed support across regions, or by those that perform strongly in the four most populous regions—Moravian-Silesian, South Moravian, Central Bohemian, and Prague—where nearly half (94) of all seats are allocated.
Changes in support over the last couple of weeks show that it is not only shifts in party preferences, but also the number of parties surpassing the five-percent threshold that plays a key role in the results. Moreover, even changes within the margin of statistical error can significantly affect the final distribution of seats. The results of the model should therefore be seen not only as a reflection of the uncertainty of mathematical calculations but also as evidence that, in the Czech electoral system, every vote can count.
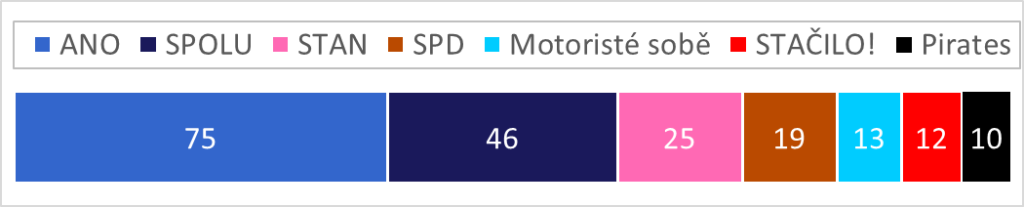
According to the latest STEM model, the ANO movement continues to clearly dominate, securing 75 seats. However, this is a lower seat count compared to previous models, due to both a further decline in support within the STEM model and the increasing number of parties projected to enter the Chamber of Deputies. Under the current distribution of power, despite ANO receiving significantly more votes, it would gain only four more seats than it did in the last parliamentary elections in 2021. Nevertheless, ANO maintains a stable position across regions, benefiting from a well-distributed voter base, which gives it a notable advantage in seat conversion. For now, ANO benefits the most when fewer parties make it into Parliament, as this boosts its seat share.
The SPOLU coalition remains in second place, having improved its position to 46 seats. The STAN movement has also made slight gains, and would now win 25 seats. In contrast, the Pirates have weakened again compared to previous models and would hypothetically receive 10 seats. SPD currently stands at 19 seats, which is one of its stronger results. The movement continues to maintain a stable core of supporters evenly spread across the country, which helps cushion the impact of any shifts in overall support on its seat total. Motoristé sobě would match their highest seat count to date this week, with 13 seats. The STAČILO! movement also remains above the five-percent threshold and would gain 12 seats.
Seat projection in case the STEM election model matched the actual results
– for the second half of March 2025 (200 seats in total)
Source: STEM for CNN Prima News, model 2025: 12, March 2025, N=1550, CAWI
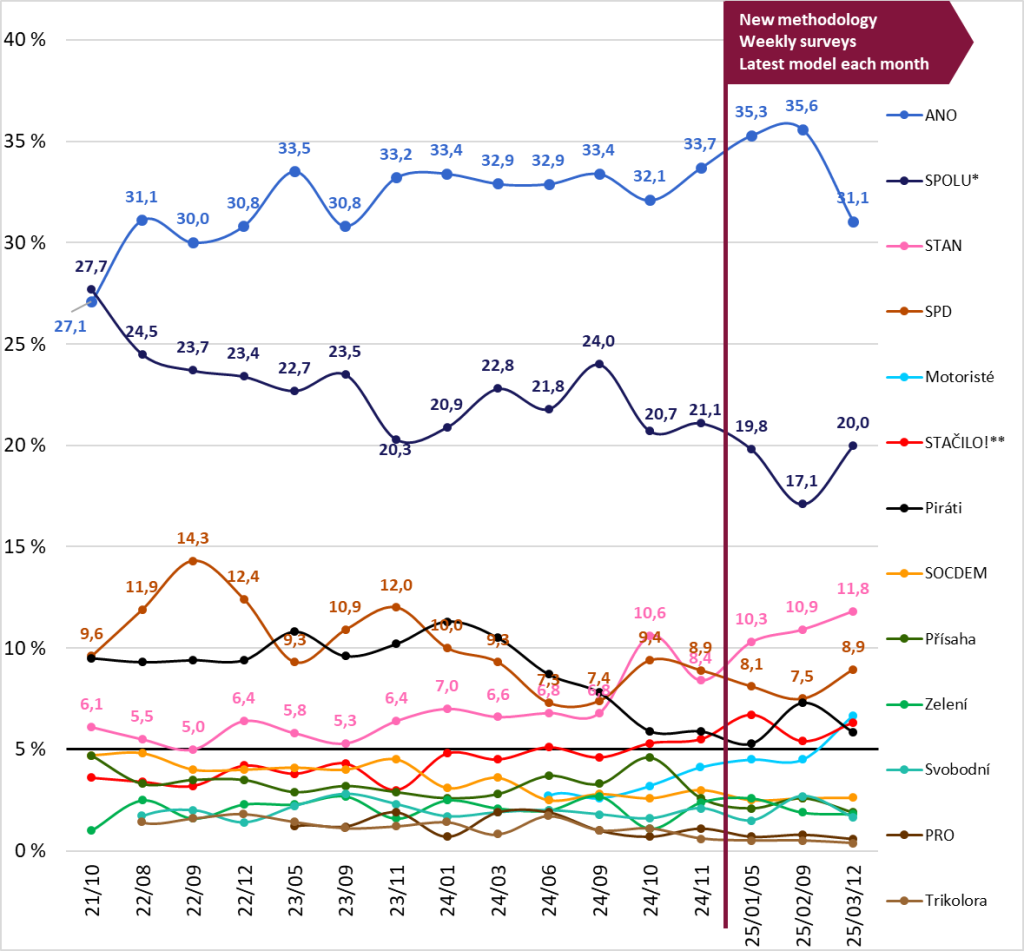
TRENDS IN THE STEM ELECTION MODEL
STEM election model results since the last (2021) general election [%]
Source: STEM for CNN Prima News, model 2025: 12, March 2025, N=1550, CAWI
Note: For parties that were ran as members of electoral coalitions in 2021, we calculated the individual parties’ vote share based on a STEM study undertaken shortly after the 2021 election.
*Until October 2024, the result of the SPOLU coalition was measured as the sum of the coalition’s three constituent parties.
**Measured as KSČM until November 2024.
Weekly election model by STEM for parties with support above 10 %
Source: STEM for CNN Prima News, model 2025, weeks 1–12, N>1500, CAWI
Weekly election model by STEM for parties with support below 10 %
Source: STEM for CNN Prima News, model 2025, weeks 1–12, N>1500, CAWI
ELECTION MODEL RESULTS BY SELECTED INDICATORS
We can examine voter behaviour in the election model grouped by generic socio-demographics. It is good to keep in mind that when splitting the election model into demographics, the statistical error also increases, and thus these sub-models should be interpreted with caution.
Election model split by sociodemographic categories
Second half of March 2025 [%]
Source: STEM for CNN Prima News, model 2025:12, March 2025, N=1550, CAWI
OVERLAPS BETWEEN THE POTENTIAL VOTER BASES OF THE SELECTED PARTIES AND MOVEMENTS
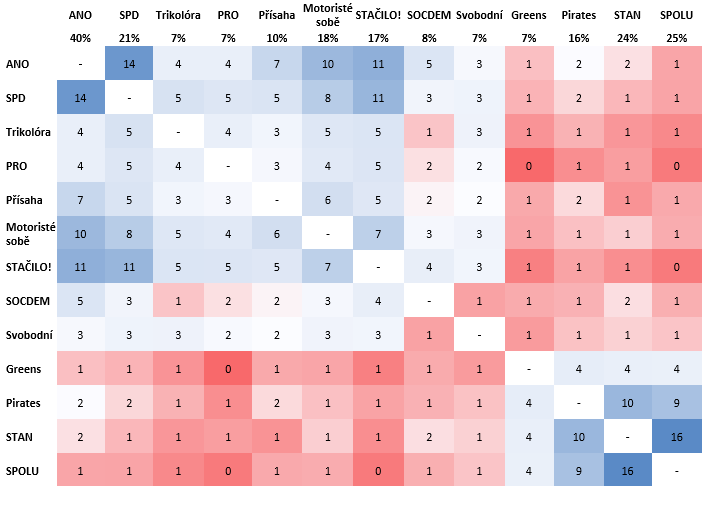
The model shows the current support for the parties, which is made out of, to varying degrees, by loyal and undecided voters. To better understand what is happening in politics, it is useful to assess the relative proximity of the parties, i.e. where each party can potentially gain additional support from.
Source: STEM for CNN Prima News, model 2025: 12, March 2025, N=1550, CAWI
Note: The number under the party name given in the column represents the party’s electoral potential. The numbers in the cells are the shares of participants who belong to the potential of both the party given in the row and the party given in the column.
MAIN FINDINGS
- STEM is publishing a weekly election model constructed using a methodology that takes into account the increased level of uncertainty and people’s hesitancy to vote.
- Around one-fifth of the public are non-voters, while two-fifths to one-half usually vote and are usually clear about whom they will support. The remaining third are unsure about coming to the polls or unclear about their choice of party. It is this group and the estimation of their voting behaviour that is crucial for voting patterns and the electoral outcome.
- The model captures the current sentiments among voters and the possible distribution of power that would result from a hypothetical election to the Chamber of Deputies if it were held in the second half of February. The parties and movements are slowly starting up their election campaigns and specify their intentions. Some have already announced joint election efforts, and further mergers or alliances may still occur.
- The model shows the current support of the parties, which is made out of, to varying degrees by, loyal and undecided voters.
- The model does not yet take into account the recently announced alliance of SPD, PRO, Trikolóra and the Svobodní party.
- Take note: the election model does not predict how the actual election will turn out but rather captures the current sentiments and estimates how the election might turn out if it were held now. The election year has always been a dynamic one, and there have been large changes in party preferences in the run-up to all recent general elections.
- Throughout March, the ANO movement experienced a gradual decline. While its support ranged between 33% and 36% earlier in the year, it would now receive “only” 31%, marking its worst result of the year in STEM’s weekly model. Nevertheless, ANO remains unchallenged as the leading voice of the opposition, with a broad base of loyal voters. Overlap in voter potential indicates that several other parties—mainly SPD, Motoristé sobě, and STAČILO!—could compete for a portion of ANO’s supporters. ANO draws significant support from citizens without a high school diploma and people over the age of 60. However, it does not perform particularly poorly in any specific sociodemographic group.
- In contrast, the SPOLU coalition saw growing support throughout March, reaching 20% in the current model. Since the beginning of the year, its support has fluctuated between 16% and 20%. SPOLU continues to enjoy relatively balanced support across age and gender groups.
- The STAN movement would get just under 12% of the vote in the second half of March. Its support has been evolving in the STEM model since the beginning of the year and is now once again approaching its best results to date. STAN’s core voter base consists primarily of younger and youngest voters.
- The consolidation of support for governing parties and the weakening of ANO may already reflect the positions and statements of political leaders regarding the international situation and issues of national security and defense. Government parties and the Pirates perform well among people with university degrees or high school diplomas, but their position is weaker among those without a high school education.
- The governing coalition parties and the Pirates, taken together, are still polling below their combined result from the previous parliamentary elections.
- The SPD movement continues to compete for the role of the main representative of protest votes. In the current STEM model, it holds nearly 9% of the vote. With the further weakening of the PRO movement and Trikolora, we are likely witnessing a natural consolidation of support shifting toward SPD. However, it is still too early to fully assess the impact of the newly announced alliance between SPD and the smaller parties. The merger of the four parties on SPD’s candidate list will be fully reflected in next week’s model. SPD continues to share a large portion of its potential voter base with ANO, and, traditionally, it maintains strong support among people without a high school diploma.
- Looking at aggregated data since the beginning of the year, we can estimate the willingness of voters from PRO, Trikolora, and the Svobodní Party to support the alliance with SPD. SPD’s average model result has been around 8% since the beginning of the year. The total potential gain from the other three parties is estimated at 3 to 4 percentage points. Of that, around 2 points seem almost certain for SPD, while another 1.5 points may require further convincing from the leaders of the allied parties. SPD is seen as a problematic choice by some supporters of the Svobodní Party.
- Motoristé sobě confirmed their highest-ever result from the previous week in the second half of March, again surpassing the 6% threshold in the STEM model. It appears that the party is gradually building a more stable voter base, which could help consolidate its performance in the long-term or even allow for further growth. The party continues to receive its strongest support from men and younger age groups.
- The STAČILO! movement currently polls at 6.3%, indicating it has stabilized above the 5% threshold. Since the beginning of the year, its support has fluctuated between 5% and 7%. The movement’s consistent performance above the threshold is likely supported by the solid and established voter base of the Communist Party of Bohemia and Moravia (KSČM), the driving force behind STAČILO!. Its supporters are primarily older voters and individuals without a high school diploma.
- Since the beginning of the year, the Pirate Party has shown extraordinarily volatile results in STEM’s models, fluctuating between 5% and 7%. Over the course of March, their support gradually declined to just under 6%. The Pirates’ position remains highly uncertain, with a particularly concerning trend being their significantly smaller core of loyal voters compared to last year.
- SOCDEM and the Přísaha movement are polling between 2% and 3%. According to current STEM models, these parties would likely not make it into the Chamber of Deputies. SOCDEM has long struggled to re-engage its former supporters or attract new ones. Přísaha has also failed to build on its solid performance in last year’s European Parliament elections. Both parties are currently in discussions regarding their potential participation in the upcoming autumn elections. SOCDEM has ruled out cooperation with the STAČILO! movement, while Přísaha will no longer continue its coalition with Motoristé sobě.
- The Green Party remains a second or even third choice option for supporters of the governing coalition or the Pirates. As a result, it enjoys only low levels of realized support and lacks a stable voter base. It remains uncertain whether the Greens would be able to surpass their 2021 election result in a real election scenario.
- The potential margin of error is +/- 1 percentage point for smaller parties and +/- 3.0 percentage points for the largest ones. The results reflect public sentiment during the time of data collection, which took place in the second half of March 2025.