The standard pre-election survey done by the STEM Research Institute is conducted by a combination of online questioning (CAWI) using the Czech National Panel and telephone interviews (CATI) by trained STEM/MARK operators on a representative sample of the 18+ Czech population. Participants are selected by quota sampling, and the ratio of CAWI to CATI responses is 70:30.
The online participants’ responses are checked for attention, length of completion, and logical linkage of responses. Telephone interviews are recorded and subject to length and quality control. Telephone operators are continuously checked and supervised. The statistical error is around ±1 percentage point for the smallest parties and around ±3 percentage points for the larger parties.
The sample for a given data collection round is always representative of the 18+ Czech population. Quota sampling is used; the quotas regard the participants’ gender, age, education, region of residence, and the population size of their municipality. To further enhance the sample’s representativeness, we further follow the cross-quotas of gender–age and gender–education. The quotas are based on data published by the Czech Statistical Office. We also pay particular attention to ensure that the sample is representative in terms of voting behaviour in the previous election to the Czech Chamber of Deputies (which took place in 2021).
We further strengthen the representativeness of the sample by weighting for deviations from the main quota characteristics, as well as weighting for past voting behaviour in the October 2021 Chamber of Deputies election, the January 2023 second round of the presidential election, and for social/employment status.
The stated preferences and model are parts of the TRENDY (“TRENDS”) regular survey, done regularly by STEM since 1993. CNN Prima News usually commissions the election model.
Model construction:
The cornerstone of the model is an open-ended question on the participants’ party preferences in a hypothetical election for the Chamber of Deputies that would have been held the following week. The participant writes down their spontaneous answer; they do not choose from any provided list.
The model itself is based on a probabilistic approach (in contrast to the legacy STEM model, used until 2021), where one participant’s answer does not necessarily translate to one vote in the model. For sporadic or hesitant voters or voters who state they are considering more than one party, we account for this uncertainty. Still, such participants do enter the model to some extent.
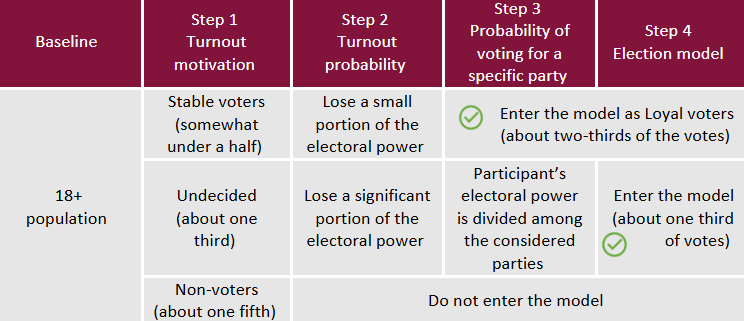
We follow a three-step process while calculating the STEM election model. First, we identify the main groups within the public based on their motivation to vote. We construct an indicator of motivation to vote based on three questions:
- willingness to vote in the upcoming election,
- general interest in political events,
- the strength of the relationship with the preferred party or movement (if the participants does prefer any).
In this way, the Czech public can be divided into three groups in terms of electoral motivation:
- Stable voters: about less than half of the people go to the parliamentary elections regularly, their participation in the parliamentary elections is very likely, and they are mostly clear about who they would vote for.
- Undecided: about one-third of the population is unsure about going to the polls at all or they are unclear about their party choice.
- Non-voters: between one-fifth and one-quarter of the population consists of non-voters whose motivation to vote is negligible.
The sum of the share of Stable voters and Undecided voters can be considered the theoretical maximum possible turnout that could be achieved in the actual election. The motivation to vote serves as a starting point for the construction of the turnout and voting model.
We do not take into account the answers of survey participants identified as Non-voters, and for the remaining two groups (Stable voters and Undecided) we estimate their probability of participation in a hypothetical parliamentary election. We calculate the likelihood of participation in the election based on the participants’ answers to questions related to their long-term, past, and expected voting behaviour:
- long-term tendency to vote,
- participation in past parliamentary elections,
- declared participation in a hypothetical general election the following week.
This probability ranges from 0 to 1, depending on how strong the participant’s voting motivation is. The weight of each participant’s vote in the model then corresponds to the probability of them turning up to the polls.
The turnout probability values are used to recalculate the data for the Stable voters group. This yields a new data set, which we refer to as Loyal voters. We treat these as the bottom threshold for the hypothetical support for the respective electoral groupings (parties and movements). In other words, these are the supporters that an electoral grouping is very unlikely to lose in the medium term, and whose support would likely only be shaken by some major scandal related to the electoral grouping. Loyal voters form the basis of the STEM electoral model, as they represent about two-thirds of the votes in the model.
Undecided voters contribute the remaining third of the votes in the model. These votes are weighed not only based on the participant’s probability of turnout but also based on the probability of them voting for the parties they are seriously considering – i.e., the participants’ expressed willingness to vote for each party is used as a weight, as well as the number of parties the participant is considering. Again, this probability takes a value between 0 and 1, depending on how (un)clearly the undecided voter expresses a willingness to vote for the mentioned parties. In the model, it is combined with the probability of turnout and applies to the group of Undecided voters.
Figure of the process of selecting participants for the model
In addition to openly stating direct support for a party or movement, the study also inquires about the participants’ willingness to vote for major Czech electoral groupings. On a seven-point scale, participants can express the degree of “acceptability” (the sum of the top three answers on the scale) for each of the parties, movements or electoral coalitions, or their “unacceptability” (the sum of the lower two answers). The maximum amount of theoretical support for a given electoral grouping is calculated as the sum of the size of the votes of those who chose one of the top three answers to the “acceptability” question (Definitely would vote, Rather would vote and Maybe would vote) for this electoral grouping, and in the analysis, we consider it as the maximum possible result for each electoral grouping.
We believe that these three data points should be taken into account when interpreting the STEM survey results in a responsible and meaningful way:
- Probable result (the electoral model itself)
- Loyal voters (the bottom threshold of support for an electoral grouping)
- Maximal hypothetical result (upper theoretical threshold of support for an electoral grouping)
